
Source & therapy data
Understand your own and competitor dispensing and category dynamics in real time through the Navi Dashboard.
REAL-WORLD DATA · IRELAND
PharmaVision is Ireland's most comprehensive real-world evidence data platform, turning longitudinal dispensing data into commercial intelligence manufacturers can act on at every stage of the product lifecycle.

BUILT FOR PHARMA COMMERCIAL, MARKET ACCESS & INSIGHTS TEAMS
Every number below is contributed dispensing data - not modelled estimates - refreshed from a live panel of community pharmacies nationwide.
From category dynamics to individual patient journeys, PharmaVision answers the commercial questions that legacy panel data leaves open.
Understand your own and competitor dispensing and category dynamics in real time through the Navi Dashboard.
Track complex medicine dispensing including oncology, biologics and specialty products across the country.
Monitor market-share shifts, new-entrant impact and pricing pressure as they unfold across your category.
Identify patients switching onto or away from your brand, and the triggers driving that behaviour.
See what is dispensed alongside your product - a powerful lens for adherence and comorbidity insight.
Link dispensing data to GP practice catchment areas to sharpen medical science liaison and KOL strategy.
Most data vendors hand you a fixed, representative sample and leave you to trust the numbers. PharmaVision keeps an ongoing, direct relationship with every contributing pharmacy, so when something needs further investigation, we can go back to the source.
THE CLOSED-LOOP DATA MODEL
Dispensing captured at source
Real transactions flow directly from partner pharmacies.
Validated & longitudinally linked
Records are cleaned and joined into continuous patient pathways.
Query the pharmacy directly
See a discrepancy or an anomaly? We investigate it with the pharmacy, not around it.
Confident commercial decisions
Intelligence you can defend, because it traces back to a real dispense.
Ongoing pharmacy access. Our relationships with contributing pharmacies are live and continuous - not a one-time data purchase - so the panel stays current.
Investigate discrepancies at the source. When a figure looks inconsistent, we can return to the pharmacy to check it - a level of assurance modelled panels can't offer.
Longitudinal, patient-level view. 1.3m patients tracked over time - so you see full pathways and switching, not just a snapshot of volumes.
Ireland-specific depth. Purpose-built for the Irish market with over 25% coverage - not a thin slice of a global dataset.
Because dispensing data is linked longitudinally, manufacturers can measure real patient engagement - initiation, persistence, switching and adherence - across the whole journey.

Prescribed
New starts and repeats captured as therapy begins.

Dispensed
Actual dispense recorded at the pharmacy counter.

Adherence
Refill timing reveals persistence and drop-off.

Switching
Movement between brands and therapies, with triggers.

Outcomes
Engagement measured to inform the next decision.
With our contributing pharmacies representing over 25% of the Irish market, PharmaVision's panel spans every county, giving you regional granularity, not just a national headline.
>30%
Share of the total Irish pharmacy market
26
Counties with active panel coverage
1.3m
Patients tracked across the network
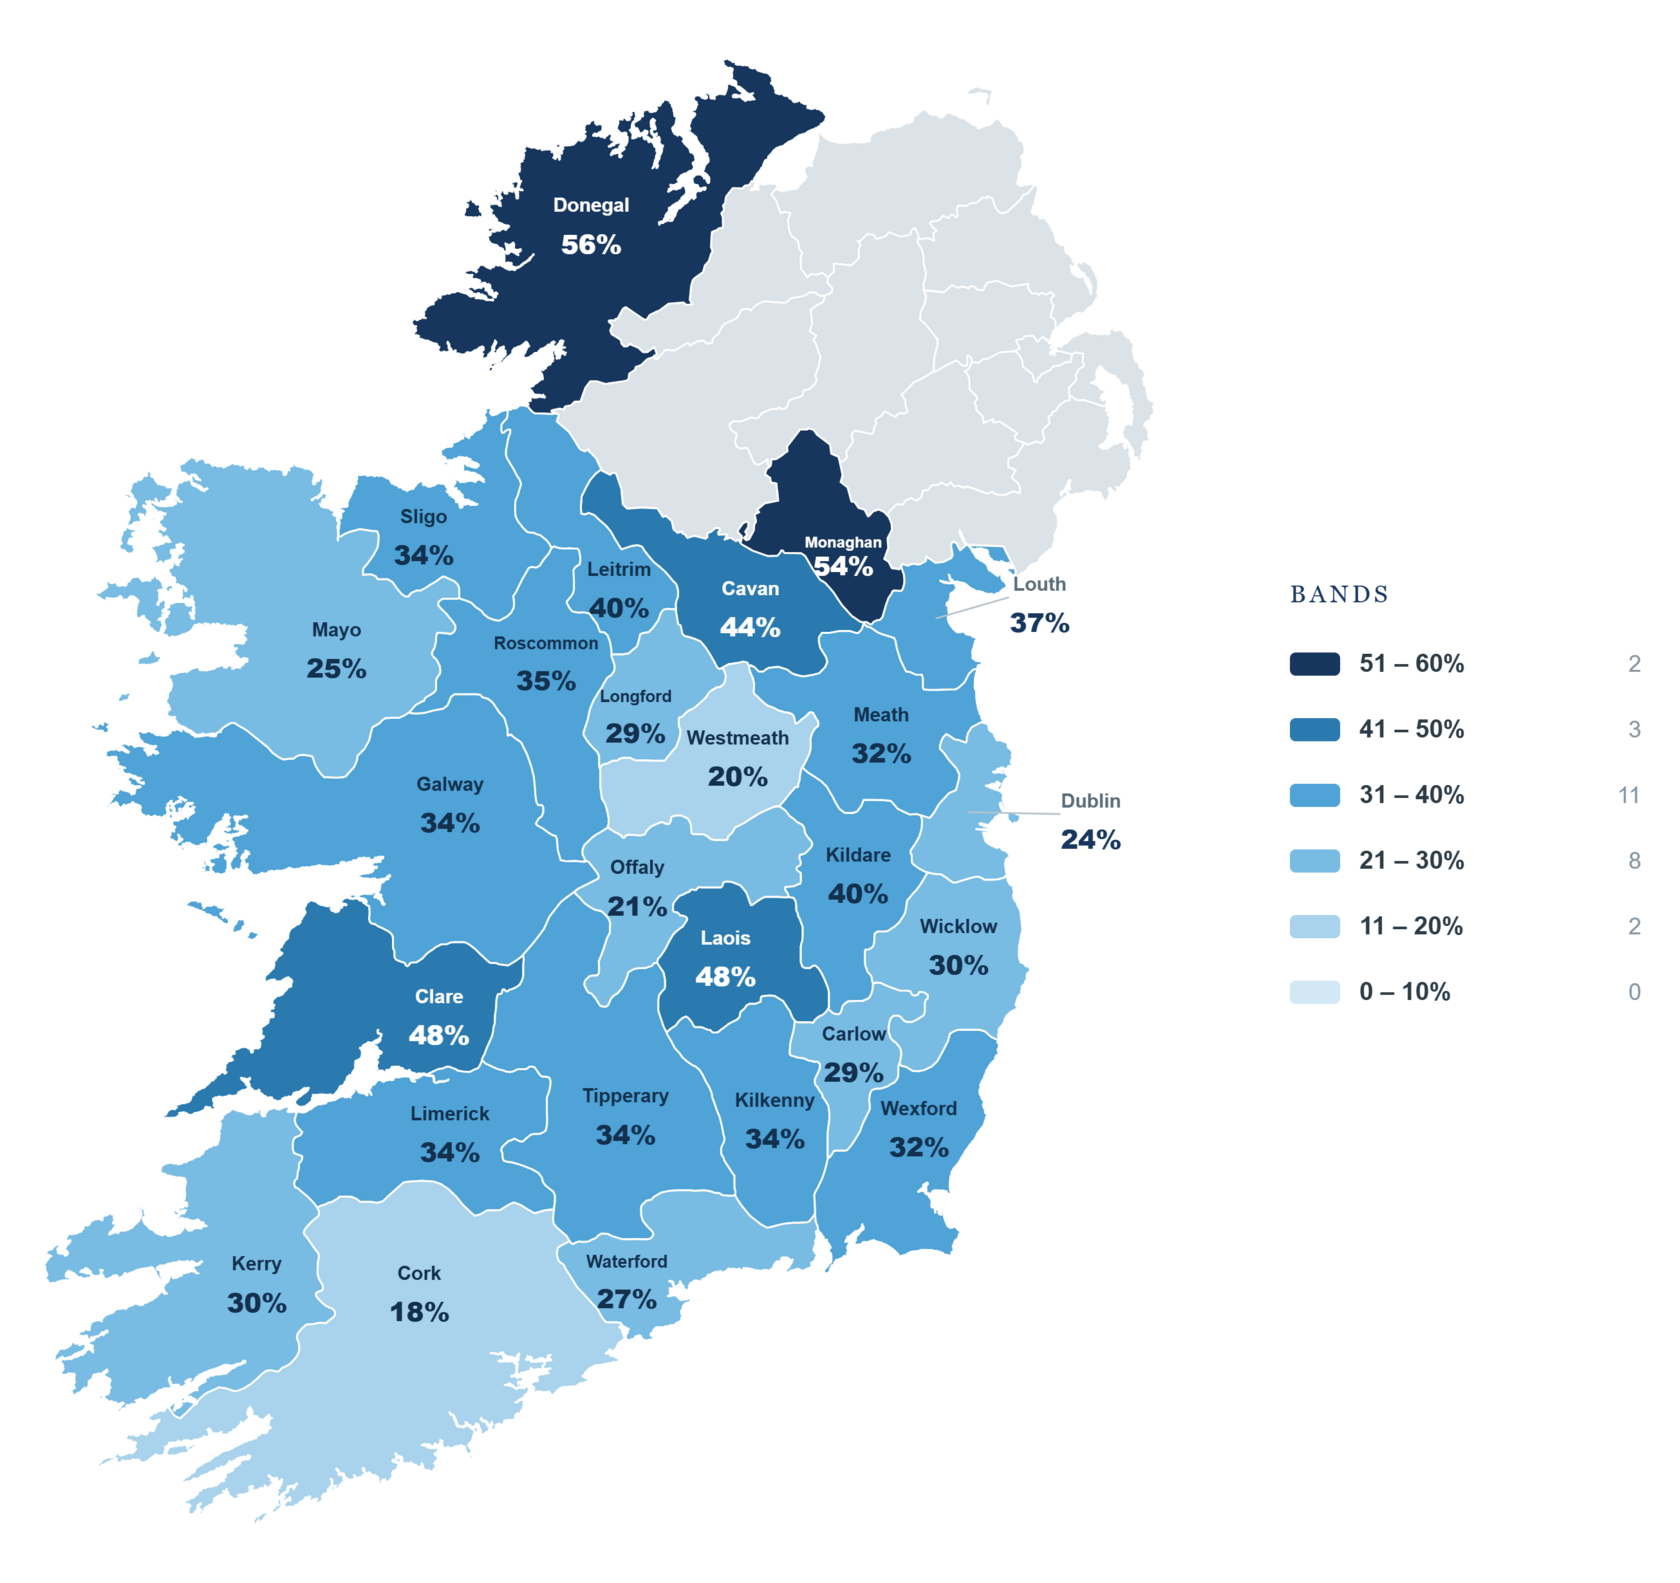
Boundaries: GADM administrative areas. Northern Ireland shown for context only.
A capability comparison against the fixed-sample model most real-world dispensing vendors rely on.
| Capability | PharmaVision | Typical panel data |
|---|---|---|
| Ongoing, direct pharmacy relationships | Live panel | Fixed sample |
| Investigate discrepancies at the source | Go back to pharmacy | Not available |
| Longitudinal, patient-level pathways | 1.3m patients | Often aggregate |
| Purpose-built for the Irish market | >25% coverage | Global slice |
| High-tech & specialty dispensing | Included | Variable |
| Real-time view via the Navi Dashboard | Self-serve | Periodic reports |
Request a demo of PharmaVision and the Navi Dashboard. We'll walk your team through the panel, the patient pathways and the questions we can answer for your brand.